
0. 前言
本文采用elasticsearch_exporter作为收集器,Prometheus作为分析器,grafana作为展示面板,从而对ES集群的所有节点进行写入、读取、CPU、JVM等等指标监控。为了保证监控程序的健壮性,本文采用了systemctl进行失败自动重启和开机自启。
采用这套方案是因为该方案的指标比官方给出的metricbeat详细,比较利于排查问题原因和发现ES集群的潜在隐患。该方案只是对ES集群进行监控,对服务器的内存使用、磁盘使用、CPU使用没有进行监控。
1. 安装elasticsearch_exporter
elasticsearch_exporter是抓取指标的客户端,可以从elasticsearch获取运行状态指标。类似metricbeat,elasticsearch_exporter可以从主节点获取信息,也可以在每个数据节点部署。如果节点数量少,就采用从主节点获取;如果节点数量多,就采用从多个节点获取信息。
运行方式(默认监听9114端口):
xxxxxxxxxx11./elasticsearch_exporter --es.uri="http://192.168.239.24:19200" --es.all --es.indices --es.indices_settings --es.indices_mappings --es.aliases --es.cluster_settings --es.shards --es.snapshots --es.timeout=30s --es.clusterinfo.interval=1m配置失败自动启和开机自启动:
xxxxxxxxxx151# /lib/systemd/system/es_exporter.service2cat >/lib/systemd/system/es_exporter.service <<EOF3[Unit]4Description=Elasticsearch Exporter5After=network.target6
7[Service]8WorkingDirectory=/data/hcl/elasticsearch_exporter-1.5.0.linux-amd649ExecStart=/data/hcl/elasticsearch_exporter-1.5.0.linux-amd64/elasticsearch_exporter --es.uri=http://192.168.239.24:19200 --es.all --es.indices --es.indices_settings --es.indices_mappings --es.aliases --es.cluster_settings --es.shards --es.snapshots --es.timeout=30s --es.clusterinfo.interval=5m10Restart=on-failure11
12[Install]13WantedBy=multi-user.target14EOF15systemctl start es_exporter
2. 安装Promethues
elasticsearch_exporter只能看临时的数据,无法看到连续的数据。而Promethues是用于存储elasticsearch_exporter收集的数据,可以通过ProSQL语言进行数据的查询。
配置文件:
xxxxxxxxxx331# my global config2global3 scrape_interval10s # Set the scrape interval to every 15 seconds. Default is every 1 minute.4 evaluation_interval10s # Evaluate rules every 15 seconds. The default is every 1 minute.5 # scrape_timeout is set to the global default (10s).6
7# Alertmanager configuration8alerting9 alertmanagers10static_configs11targets12 # - alertmanager:909313
14# Load rules once and periodically evaluate them according to the global 'evaluation_interval'.15rule_files16 # - "first_rules.yml"17 # - "second_rules.yml"18
19# A scrape configuration containing exactly one endpoint to scrape:20# Here it's Prometheus itself.21scrape_configs22 # The job name is added as a label `job=<job_name>` to any timeseries scraped from this config.23job_name"prometheus"24
25 # metrics_path defaults to '/metrics'26 # scheme defaults to 'http'.27
28 static_configs29targets"localhost:9090"30
31job_name"elasticsearch"32 static_configs33targets"172.16.80.168:9114"由于目前没管告警配置,所以不需要关注alerting和rule_files,Prometheus默认收集了自身的信息,如:job_name: "prometheus"。为了收集elasticsearch_exporter数据,需要添加一个job_name,如上图所示。
默认设置,数据文件只会保留最近的15天,可以通过--storage.tsdb.retention.time=180d设置为180天。
运行方式(默认监听9090):
-web.enable-lifecle 选项可以自动识别配置文件是否改动
xxxxxxxxxx11./prometheus --web.enable-lifecycle配置失败自动启和开机自启动:
xxxxxxxxxx151# /lib/systemd/system/prometheus.service2cat >/lib/systemd/system/prometheus.service <<EOF3[Unit]4Description=prometheus5After=network.target6
7[Service]8WorkingDirectory=/data/hcl/prometheus-2.37.0.linux-amd649ExecStart=/data/hcl/prometheus-2.37.0.linux-amd64/prometheus --web.enable-lifecycle --storage.tsdb.retention.time=180d10Restart=on-failure11
12[Install]13WantedBy=multi-user.target14EOF15systemctl start prometheus
3. 安装grafana
grafana是可视化界面,可以理解为prometheus的web ui界面,可以通过别人设计好的dashboard展示数据。
启动方式(默认监听3000):
xxxxxxxxxx11./grafana-server web第一次登录,需要修改密码。
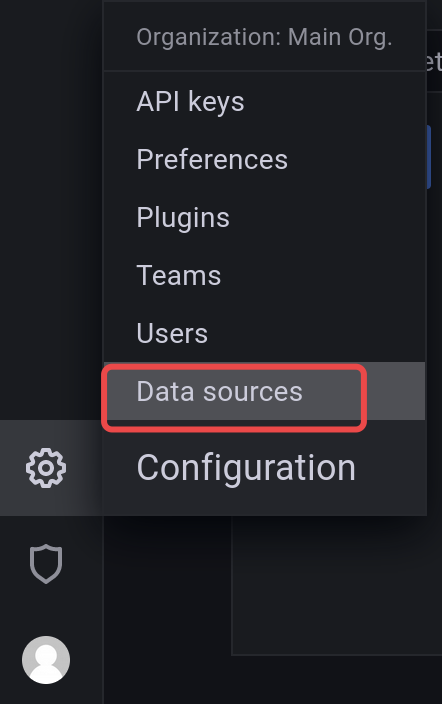
添加数据源:
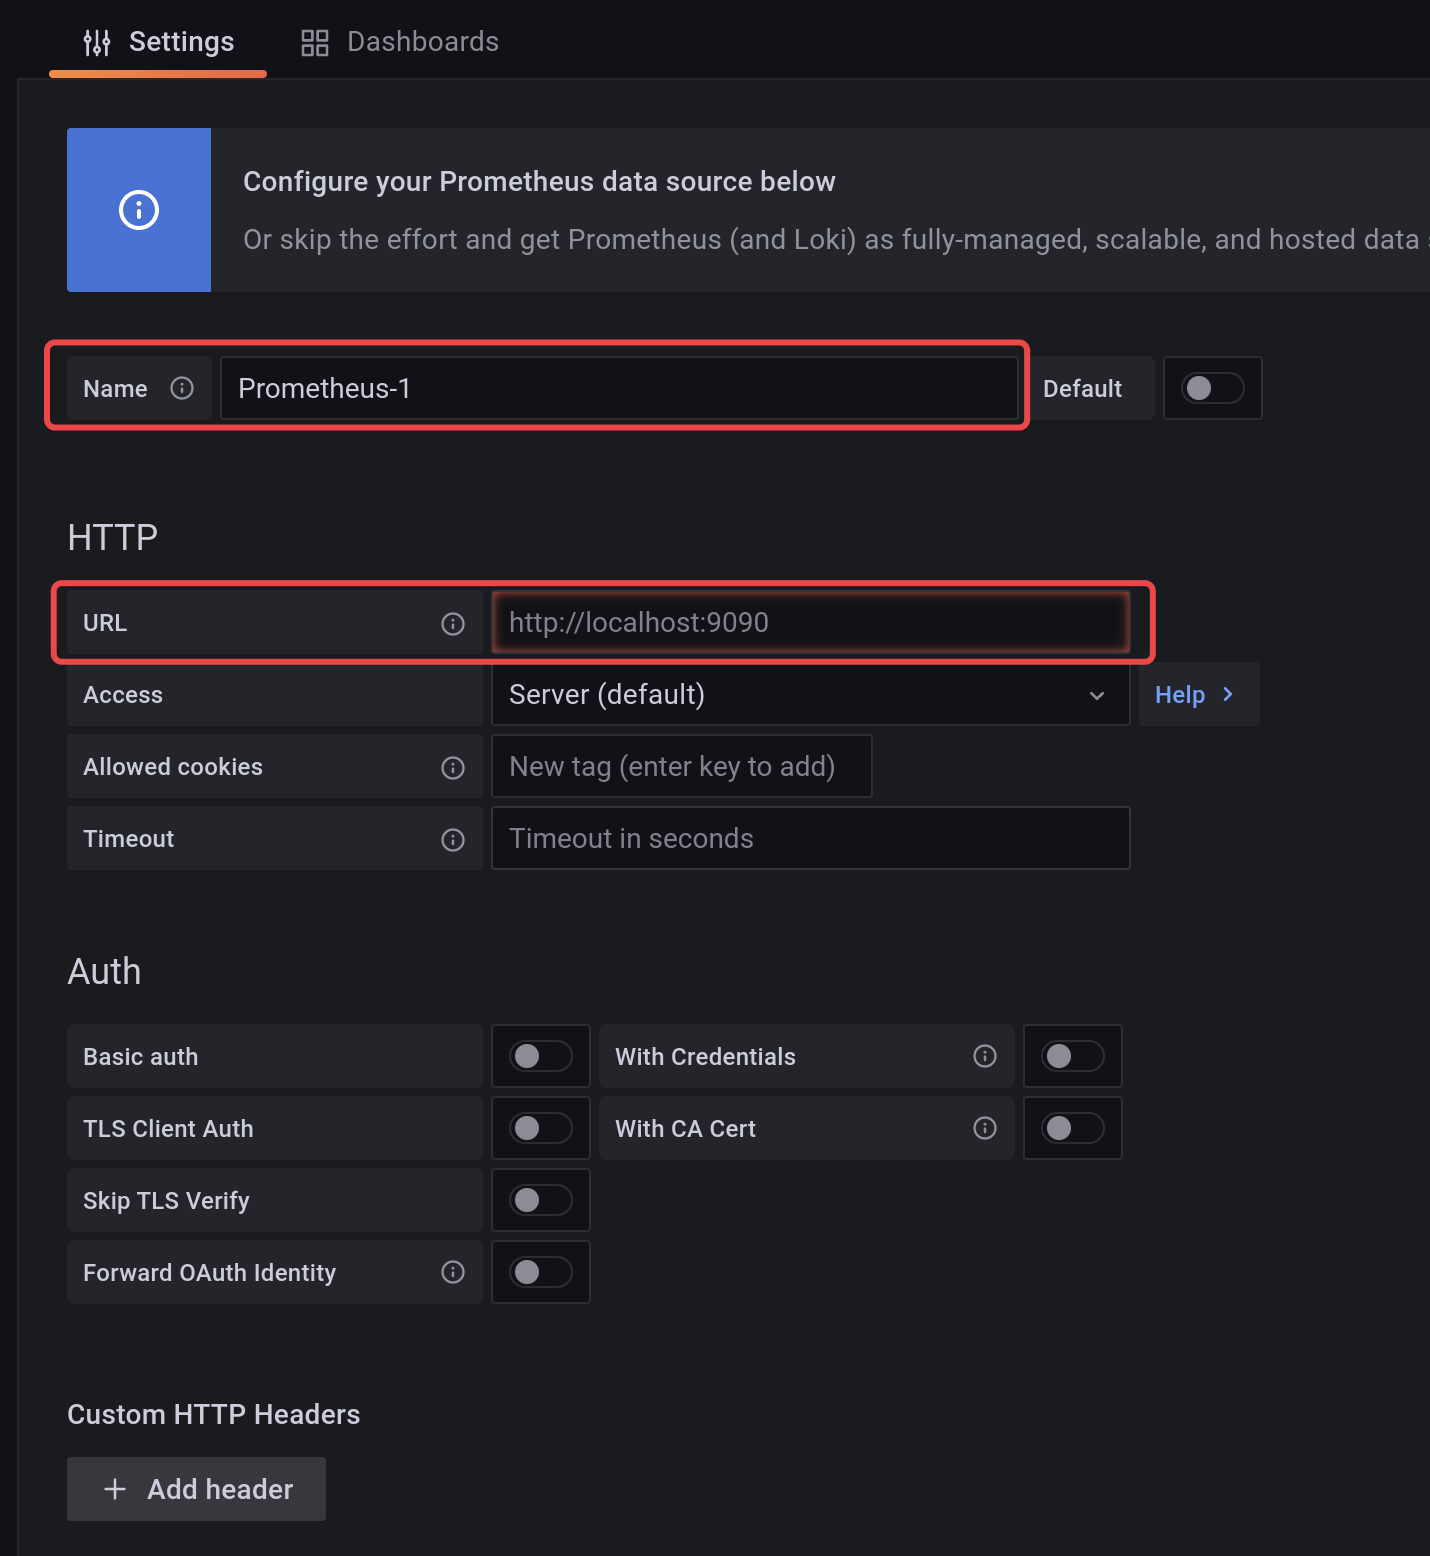
填写Prometheus的ip和端口(默认9090):
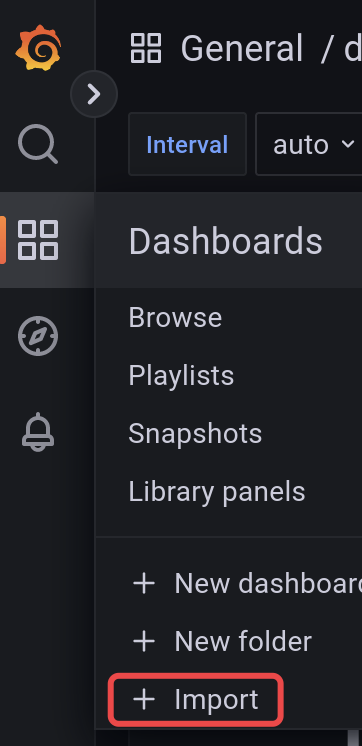
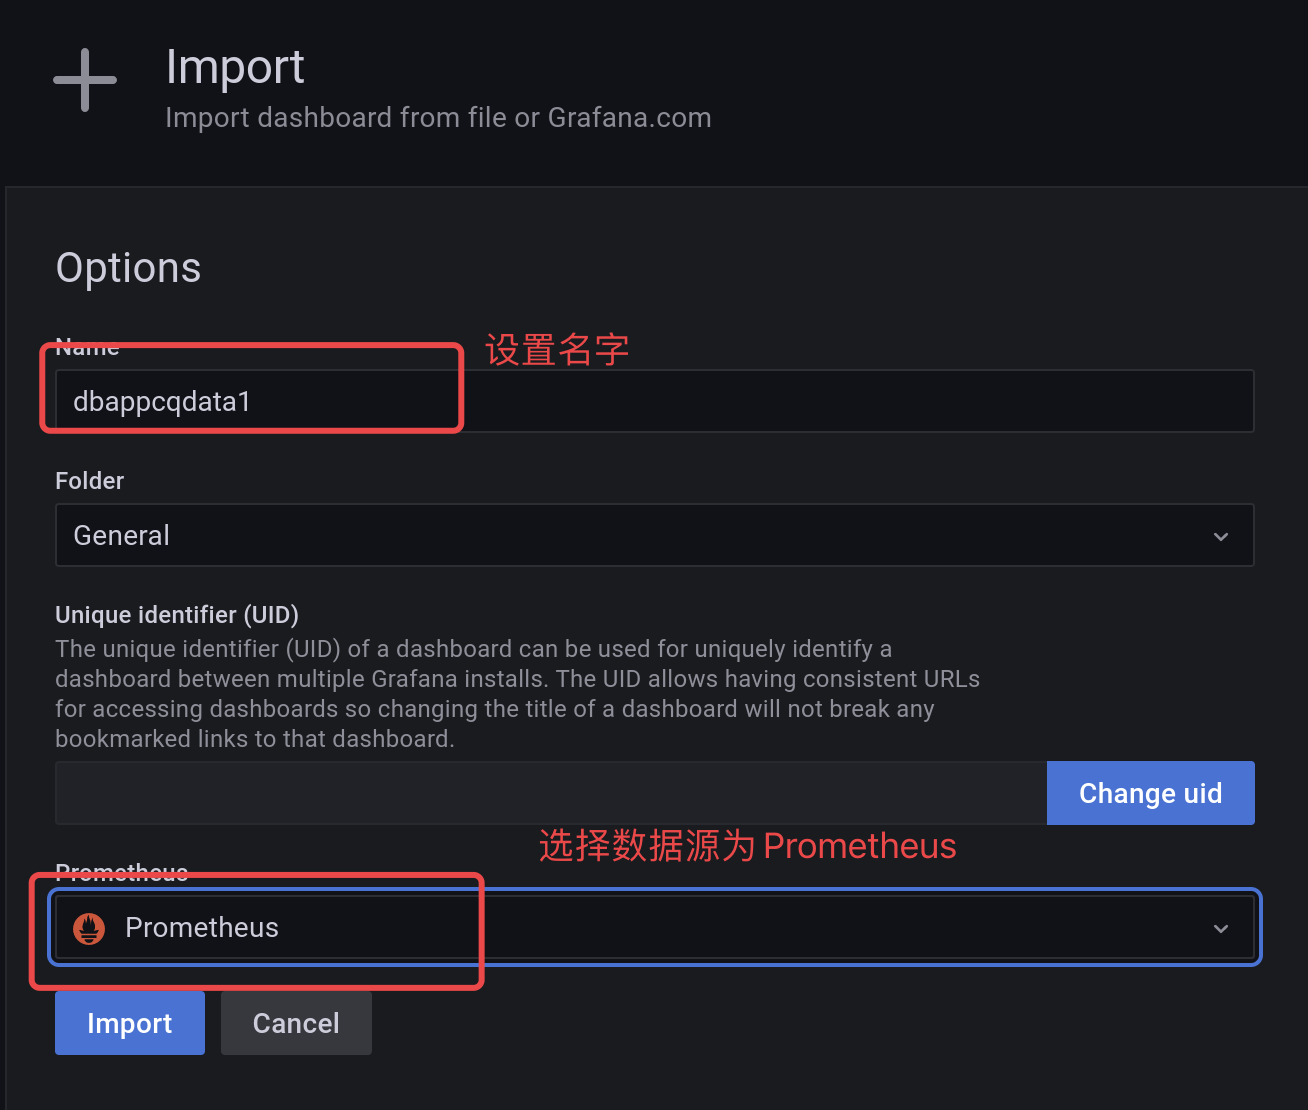
导入es的监控dashboard(https://grafana.com/grafana/dashboards/6483-elasticsearch/):
配置开机自启:
xxxxxxxxxx151# /lib/systemd/system/grafana.service2cat >/lib/systemd/system/grafana.service <<EOF3[Unit]4Description=prometheus5After=network.target6
7[Service]8WorkingDirectory=/data/hcl/grafana-9.0.69ExecStart=/data/hcl/grafana-9.0.6/bin/grafana-server web10Restart=on-failure11
12[Install]13WantedBy=multi-user.target14EOF15systemctl start grafana
Comments NOTHING